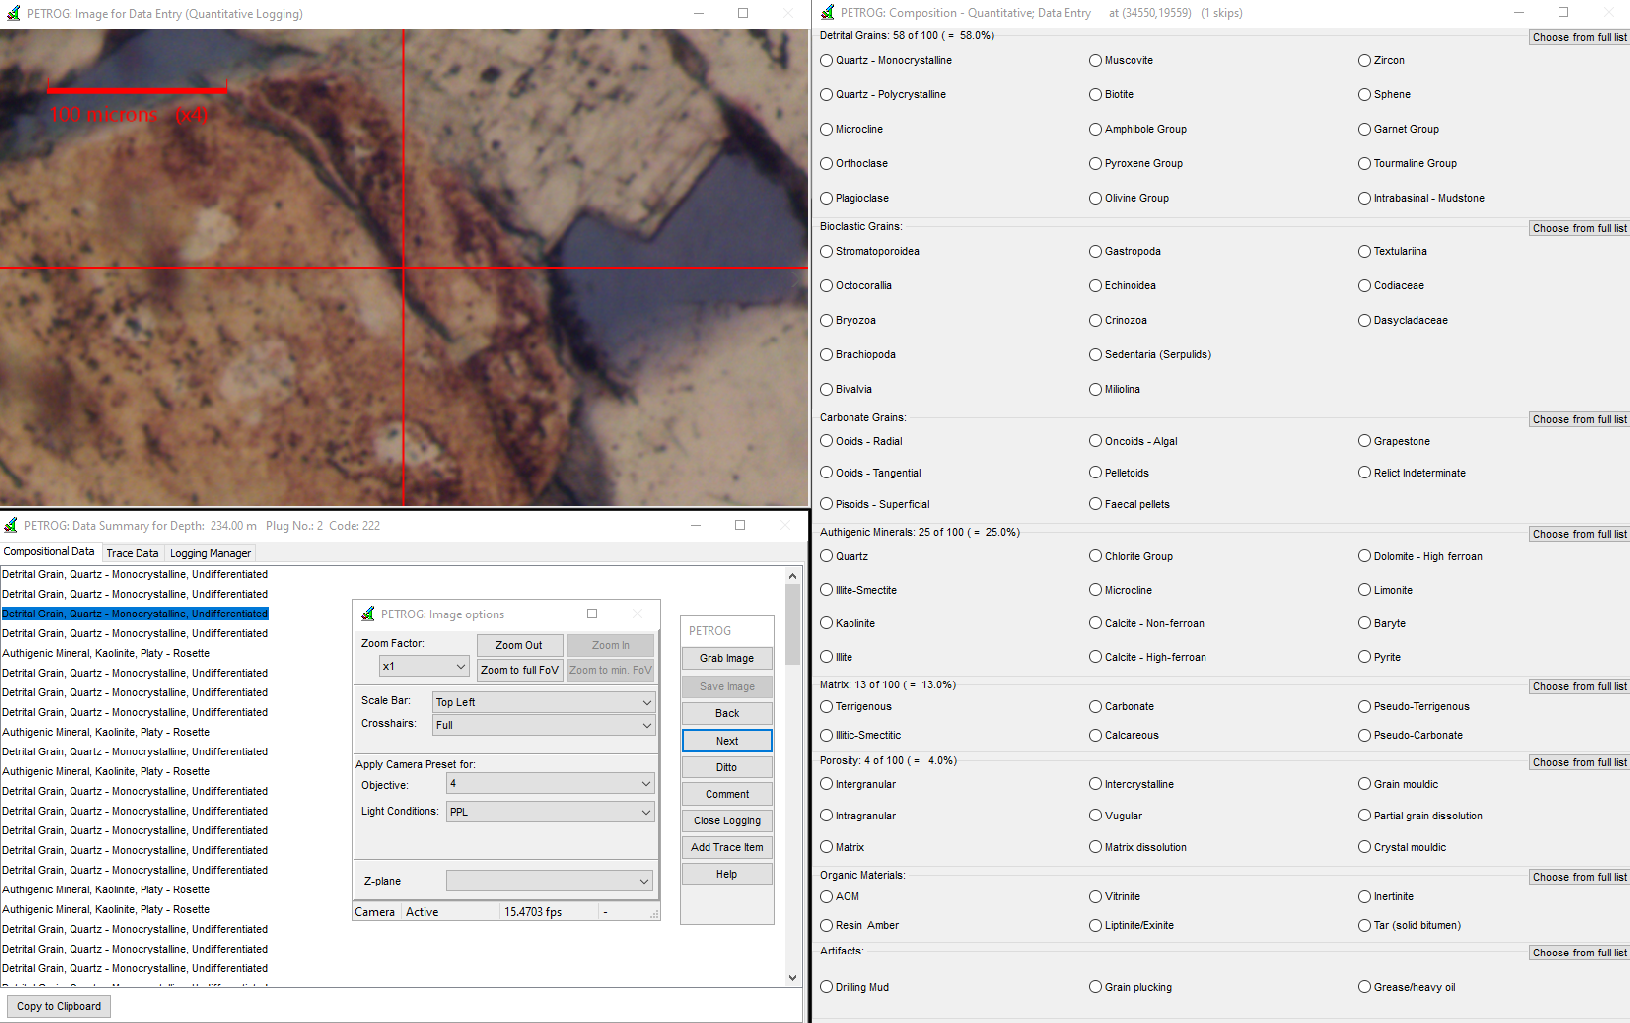
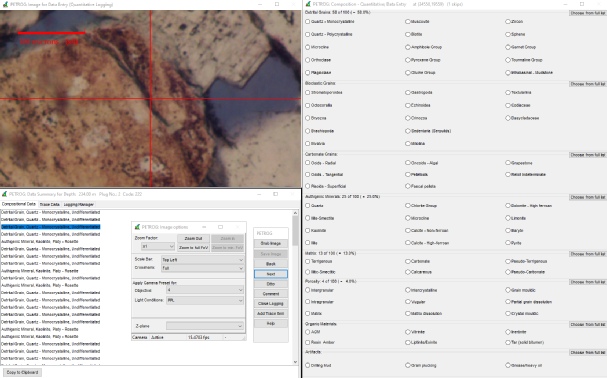
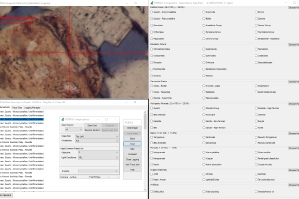
Compositional data is collected and described directly by the petrographer, with PETROG providing a structured framework for recording expert geological observations using hierarchical items, qualifiers, and relationships.
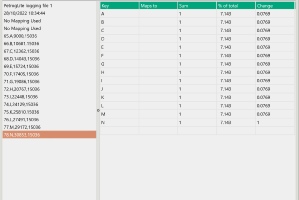
Data entry is guided by TickLists, hierarchical reference lists, Keyboard Mappings, and comparator images, ensuring consistent recording of minerals, porosity types, cements, and grain-derived components.
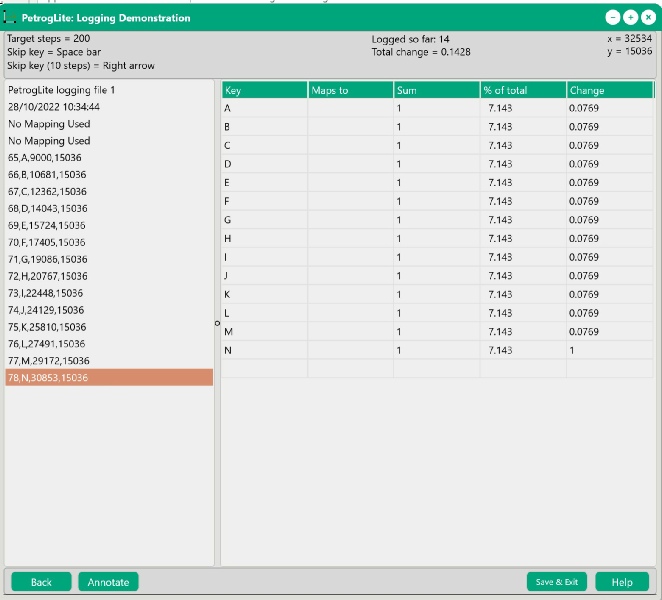
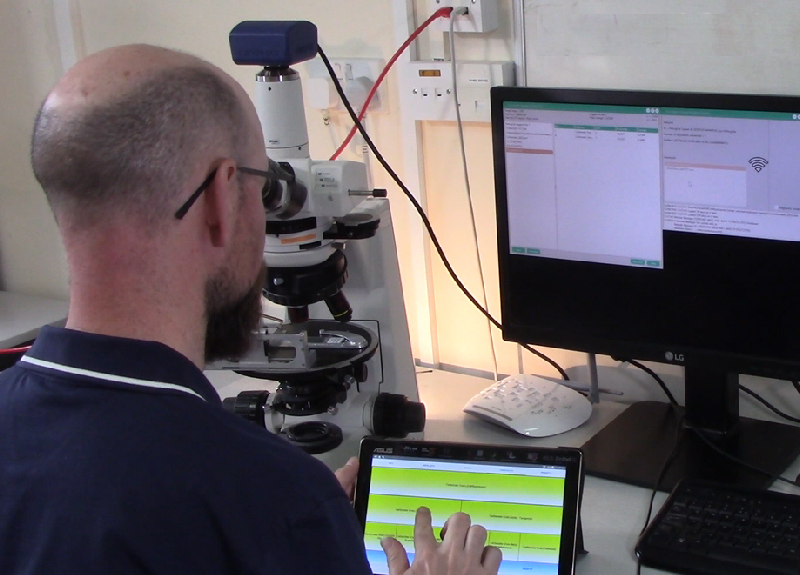
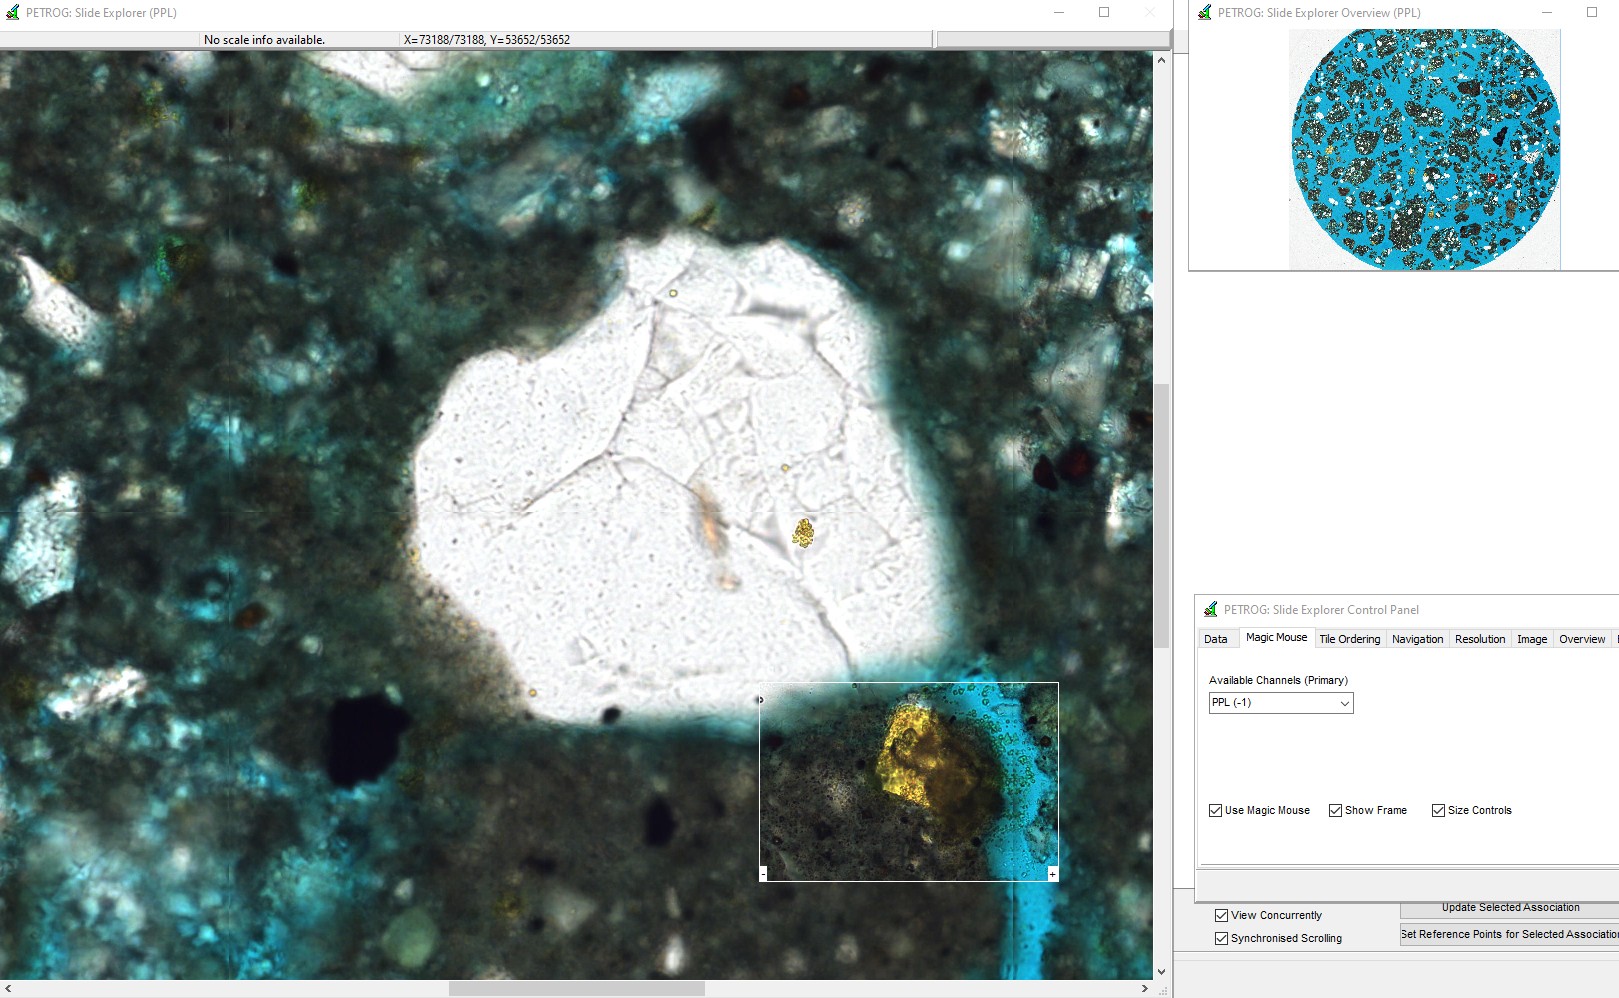
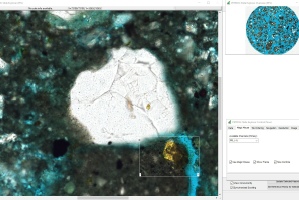
Quantitative compositional logging works with actual thin sections via the SteppingStage or with imported whole-slide scans, allowing point-counting and multi-level compositional description across both live microscope feeds and scanned-image datasets.
Comprehensive editing and review tools allow users to modify class/item/qualifier/relationship selections, add missing items, perform QC by inspecting associated images and navigating back to the original SteppingStage positions, and generate summaries or exports via the Data Grid and Summary by Class views.
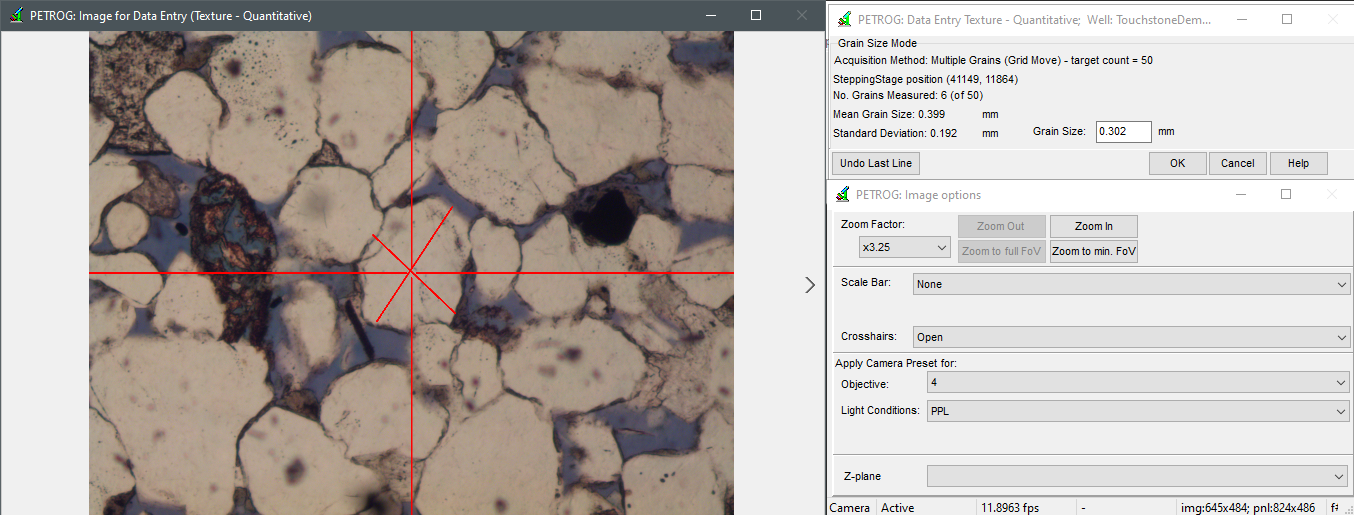
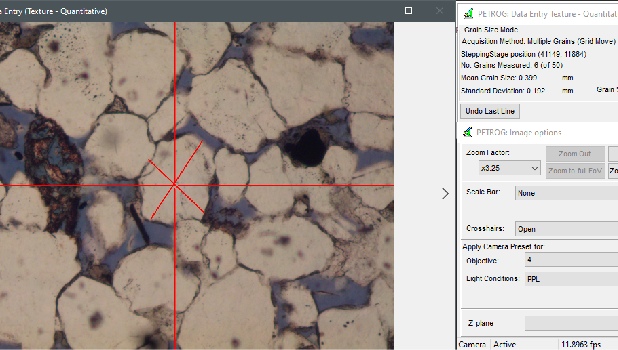
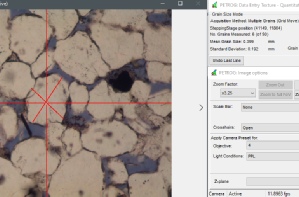
Quantitative textural data is collected directly by the petrographer, using PETROG’s measurement tools to capture major and minor axis grain dimensions from live microscope imagery or imported whole-slide scans, with real-time calculation of mean, standard deviation, and other grain-size statistics.
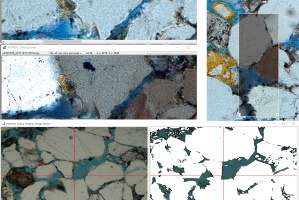
PETROG also supports outline logging, allowing petrographers to digitise grain boundaries and generate extended textural data such as perimeter, area, and node-tagged properties (e.g., Touchstone grain-coating attributes). This can be performed during point counting, or as a separate pass revisiting logged points matching a specified grain type. Collection and annotation of grain perimeters is via an interactive workflow tool that provides full data-edit capabilities.
Visual estimation workflows allow petrographers to record grain size, sorting, morphology, and rock fabric using comparator images, providing structured qualitative textural descriptions alongside quantitative measurements.
Quantitative textural data can be edited and quality-checked through PETROG’s dedicated editing window, where users can review and edit individual grain-size measurements, examine statistical summaries and histograms, explore orientation data via Rose or Kite diagrams, and export or print both data and graphics for further analysis.
Technical Overview
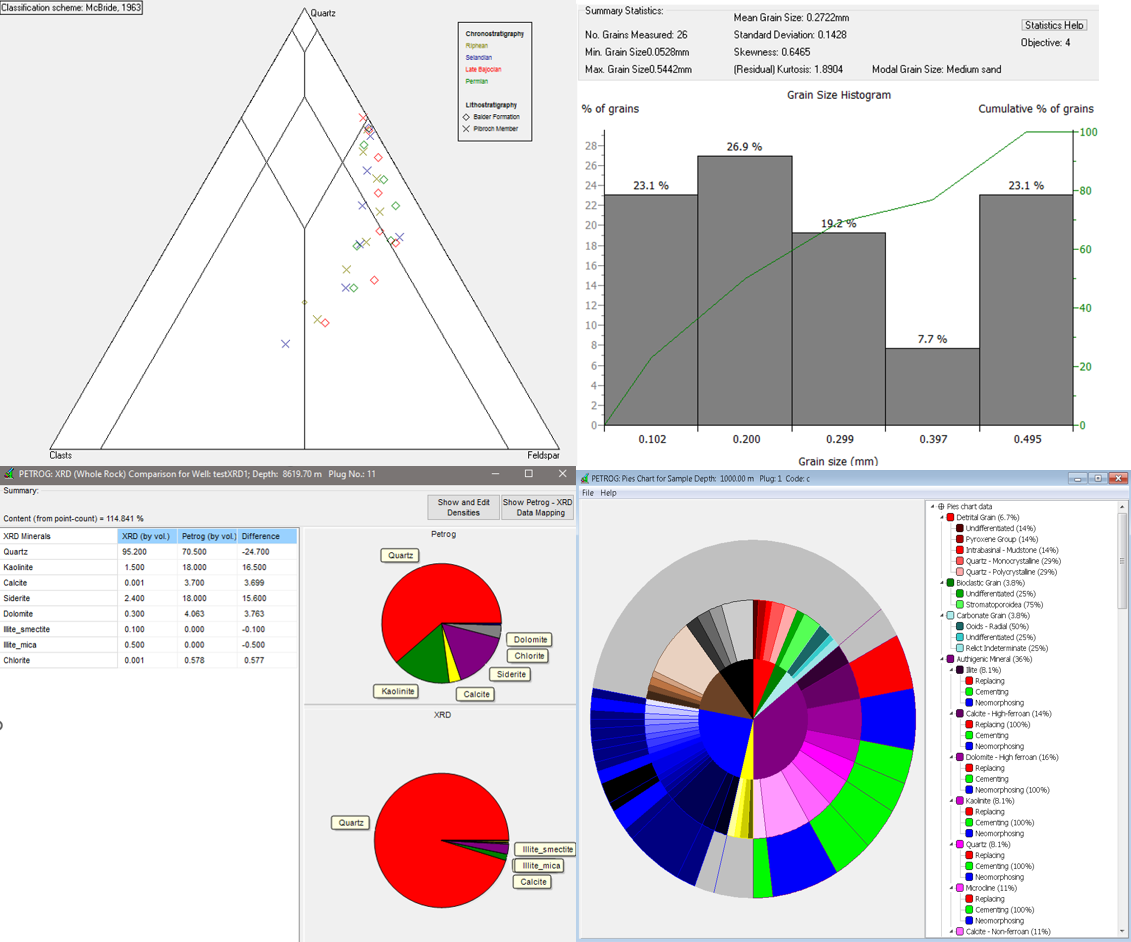
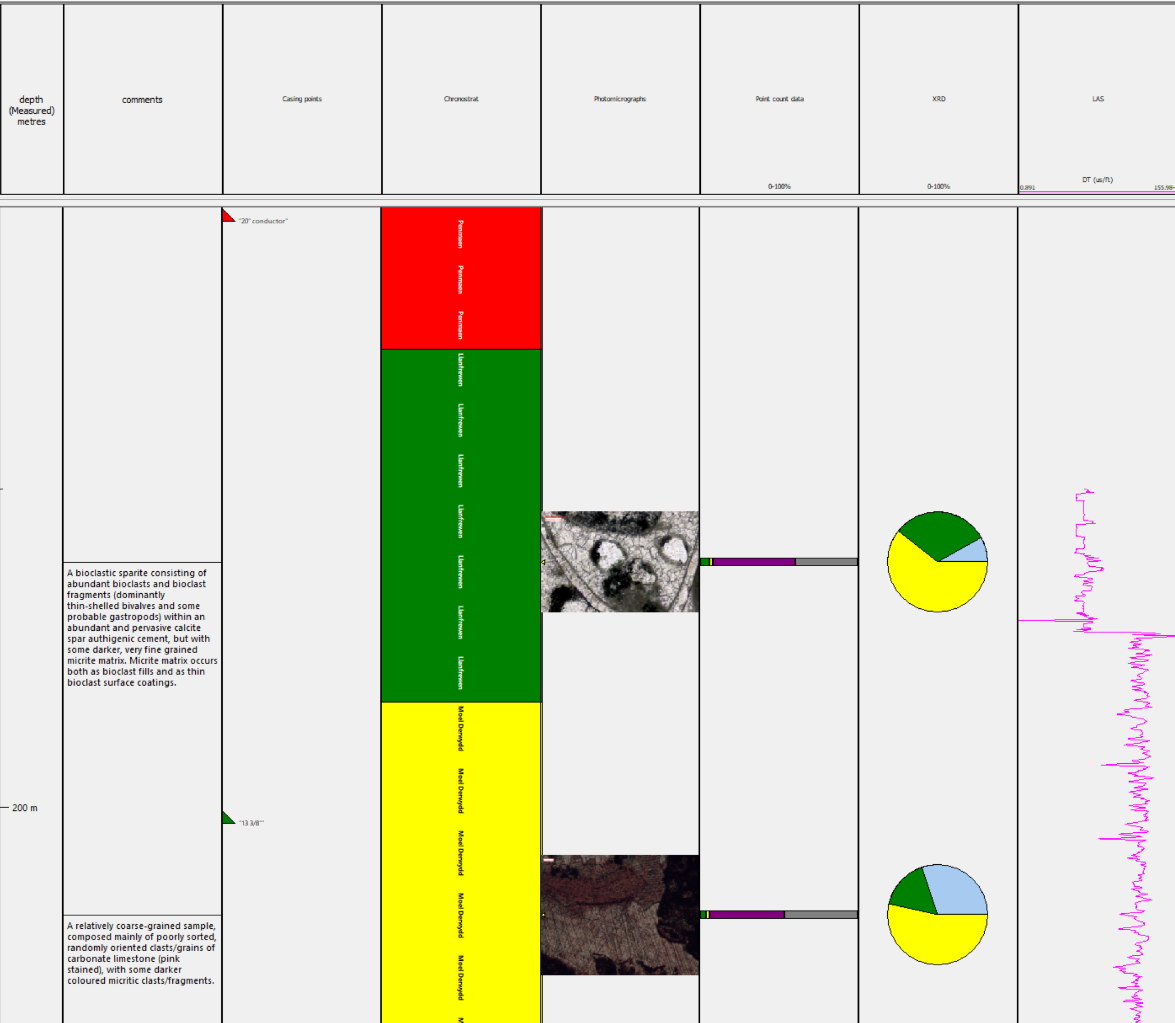
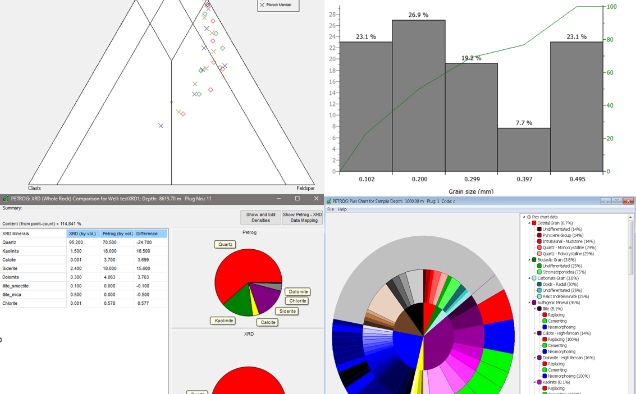
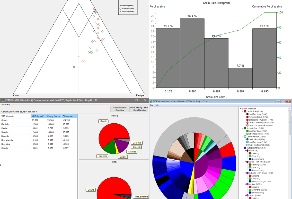
PETROG’s Analysis / Reporting tools provide detailed summaries of both observed and edited data, together with values calculated automatically by the software. This includes derived mineralogical and porosity metrics, and also incorporates XRD comparison, allowing imported bulk-rock XRD data to be viewed alongside PETROG point-count results with options for weight-%/volume-% display, microporosity handling, and density-based conversions. All such review outputs can be exported for further interpretation or integration into external workflows.
The Mineralogical Summary and Porosity Summary windows present the most complete synthesis available for each sample, drawing on quantitative data where present. PETROG reconstructs original mineralogy prior to diagenetic modification and calculates microporosity components based on the microporosity methodology defined for the sample. Because these windows are fully linked to the Edit Composition window, any changes made during data editing are reflected immediately, enabling rapid “what-if” analyses where petrographers can explore the impact of alternative interpretations or adjustments.
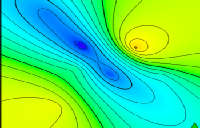
PETROG includes a suite of diagramming and visualisation tools. The Ternary Diagram tool allows users to select samples, define end-member components, adjust symbol formatting, and overlay lithological classification schemes. Concentric Pies provide a colour-coded, hierarchical visualisation of Class/Item/Qualifier subdivisions, offering an intuitive overview of compositional structure within a sample. All diagrams can be exported in multiple graphical formats or copied to the clipboard for use in reports and presentations.
PETROG provides extensive reporting capabilities for exporting compositional, textural, and image-based data into spreadsheet and printer/PDF-ready formats. Spreadsheet reports allow flexible selection of geological items, hierarchical levels, qualifiers, relationships, compound items, ternary classifications, and sample subsets, with PETROG automatically aggregating or subdividing items according to the report template. Printer-ready reports support selective inclusion of images, adjustable image resolution, and fully configurable page templates with editable headers, footers, data boxes, and embedded pictures. Dedicated grain-size reports provide complete measurement and statistical datasets for all samples in a project, ready for external analysis or incorporation into third-party software.
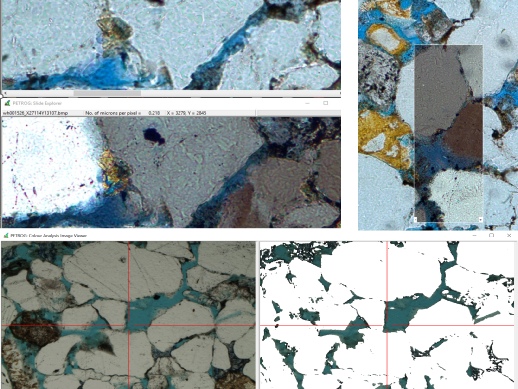
PETROG automatically captures images during point counting, with the option for petrographers to save both plain-polarised and cross-polarised views at specific points. Images are stored with full sample and point metadata, enabling later review, re-analysis, or inclusion in reports.
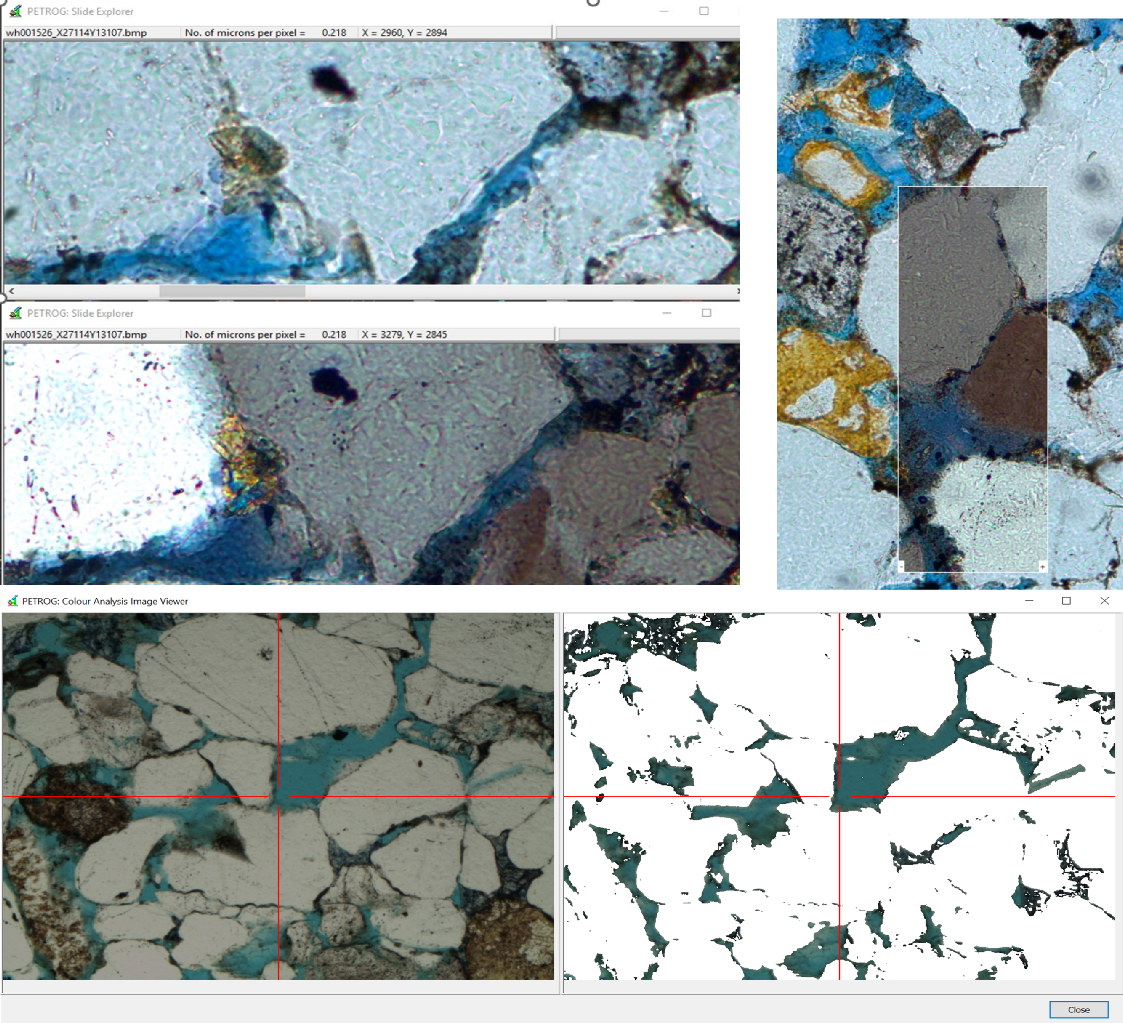
PETROG allows users to save “Points of Interest” with names, descriptions, and reasons, enabling rapid return to specific locations under the microscope. For virtual whole-slide images—whether imported scans or stitched mosaics—Points of Interest can also be defined and revisited, providing consistent navigation within large digital slides.
PETROG includes a Colour Analysis Tool that can generate Output Layers from single or virtual images, based on available compositional data or user point/region selection from candidate images. These layers classify pixel colours in a 2D colour space and can be tested, exported, and applied to images to identify features such as porosity. During textural logging, saved Output Layers can assist with grain or pore boundary digitisation, allowing users to accept or reject automatically calculated outlines.
PETROG can apply Colour Analysis Output Layers to whole-slide images, whether imported directly or generated through stitching. This enables automated estimation of total porosity across an entire thin section, providing a rapid, objective assessment of pore distribution and abundance at the sample scale.
PETROG provides a complete environment for quantitative petrography, built around fast, reproducible point-counting, bespoke image analysis techniques, and integrated data analysis and reporting tools. The system is engineered to streamline petrographic workflows, reduce operator effort, and deliver consistent, statistically robust datasets.
PETROG™: The Complete Digital Petrography System for Industry, Academic Research and Teaching
Product EcosystemTechnical OverviewApplication AreasDemonstrationsTrainingNews

Demonstrations

News

Training

Application Areas

|
Clastic Petrography
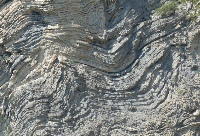
PETROG is the leading platform for clastic petrographic analysis in sedimentary basin evaluation, reservoir quality assessment and academic research, supporting geoscientists worldwide in delivering consistent, high-resolution insights into sandstones, siltstones and shales.
|
|
|
Carbonate Petrography
PETROG is the trusted solution for carbonate petrography in reservoir characterisation, diagenetic interpretation and academic research, enabling geoscientists worldwide to analyse limestones and dolomites with precision, consistency and high-resolution detail.
|
|

|
Academic
PETROG is used by research facilities and universities for a variety of innovative projects. We have collected some of the published results. >>
|
|
|
Teaching Petrography
PETROG is used by universities and training facilities for teaching petrography and petrographic analysis.
|
|

|
Archives and Artificial Intelligence
PETROG can be used to digitalise your archives and legacy data, and import from other sources.
Consistently structured data and analysis can be used to provide training sets for AI systems. >>
|
|

|
Oil and Gas
PETROG is the first choice for petrographic analysis in hydrocarbon exploration, development and production around the world, as well as in the major university research groups. >>
|
|
|
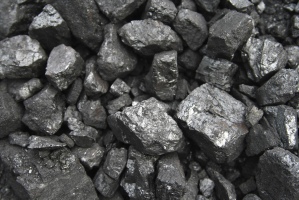
Coal
PETROG is being used to monitor the quality of coal from mining through to point of use, supporting ICCP standards and procedures. >>
|
|
|
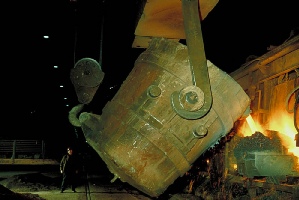
Steel
PETROG is being used to quality assure the inputs to the steel-making process. Since minor differences in coal composition can have major impacts, controlling feed of all inputs based on an accurate, quantitative knowledge of coal feed composition is sound economic sense.
|
|
|
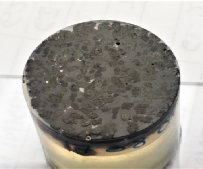
Concrete
PETROG is being used to check the quality and content of concrete both retrospectively, to provide accurate, quantitative data to support analytical reports and statutory analyses, and predictively, where exact composition is critical. >>
|
|
|
Ceramics in Archaeology
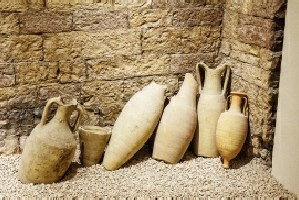
PETROG is being used for compositional characterisation of archaeological pottery, building materials and plaster-based artefacts, as well as the interpretation of their raw materials and production technology. >>
|
|
|
Cement Clinker
Point-counting with PETROG is an important method for quality assurance of cement clinker. >>
|
|
|
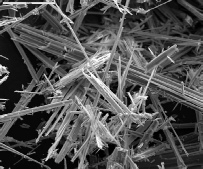
Asbestos
PETROG is used to point count asbestos in environmental monitoring. >>
|
PETROG - Compositional Data Collection
PETROG - Textural Data Collection
PETROG - Analysis / Reporting
Fits rotary stage - thin section
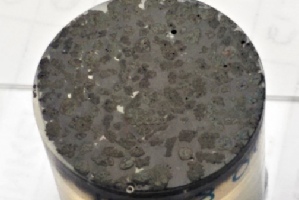
Fits rotary stage - polished block
PETROG Virtual Keyboard (PVK)
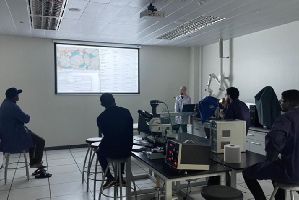
On-site and Remote Training
At its core, PETROG combines advanced visualisation tools with integrated measurement and classification routines for both transmitted-light thin sections and reflected-light polished blocks. This functionality is underpinned by a comprehensive relational database that preserves metadata and provides audit trails for quality assurance. PETROG’s analytical workflow utilises a controlled vocabulary and rule-driven classification system that standardises how compositional and textural data are recorded. By constraining petrographic descriptions to a shared dictionary and methodological framework, PETROG eliminates operator-specific variability and ensures that datasets generated by different petrographers remain fully compatible. This guarantees methodological continuity across projects, supports robust statistical comparison, preserves long-term data integrity for corporate and research archives, and ensures that the datasets are suitable for input to Machine Learning / Artificial Intelligence systems.
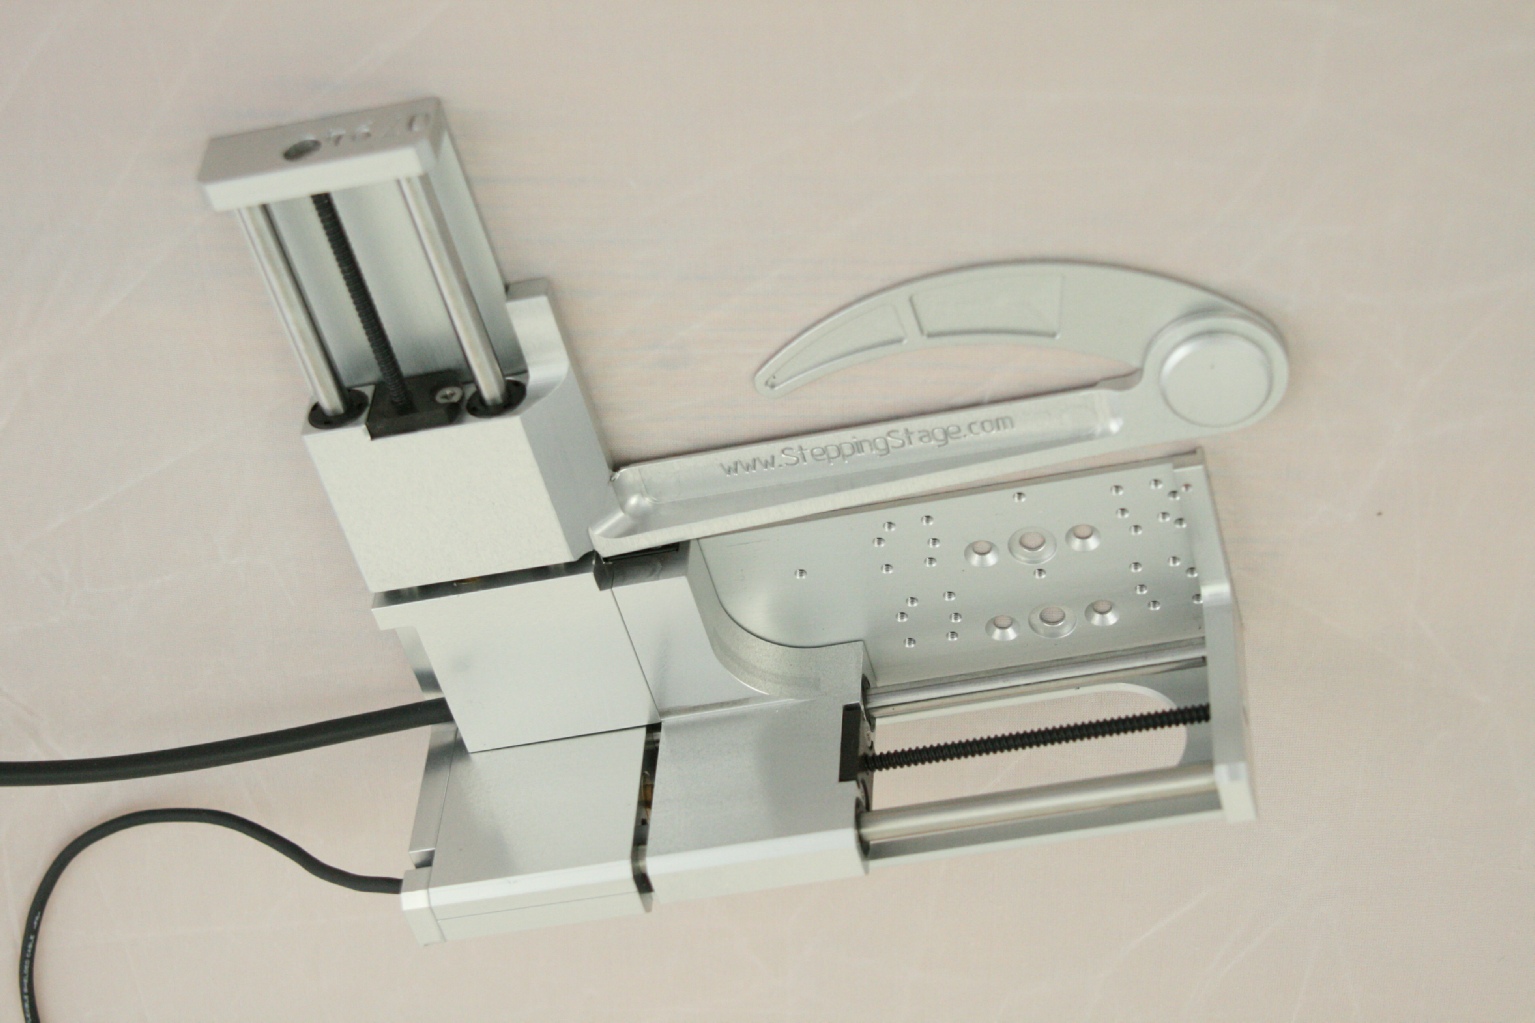
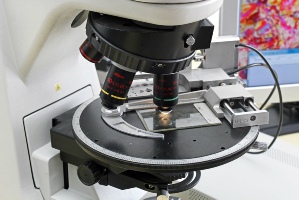
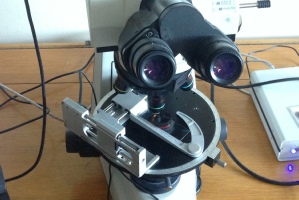
To facilitate automated point counting, PETROG incorporates our digitally controlled, fully motorised SteppingStage. This precision hardware enables accurate, repeatable movement across the slide, ensuring high-quality compositional analysis and textural quantification. PETROG also integrates seamlessly with high-resolution slide scanners and microscope cameras, supporting real-time video acquisition or imported multi-resolution whole slide image scans. These imaging capabilities allow users to work interchangeably with live microscope views, scanned thin sections, and large-format digital petrography datasets within a single unified workflow.

Registered in England and Wales company # 03449181.
This website does not use cookies.
Conwy Valley Systems Limited,
West Acre, Llys Helyg, Deganwy
CONWY LL31 9BN, United Kingdom.
VAT# GB 741 5190 48
A Geoscience Wales founding member.
PETROG includes patent protected technology.